概要
基本知识准备
- 认识冻结帧FrozenFrame(FF)
- Google Play Console(GPC)针对FF的各项指标含义
- FF所属大类——SlowRendering
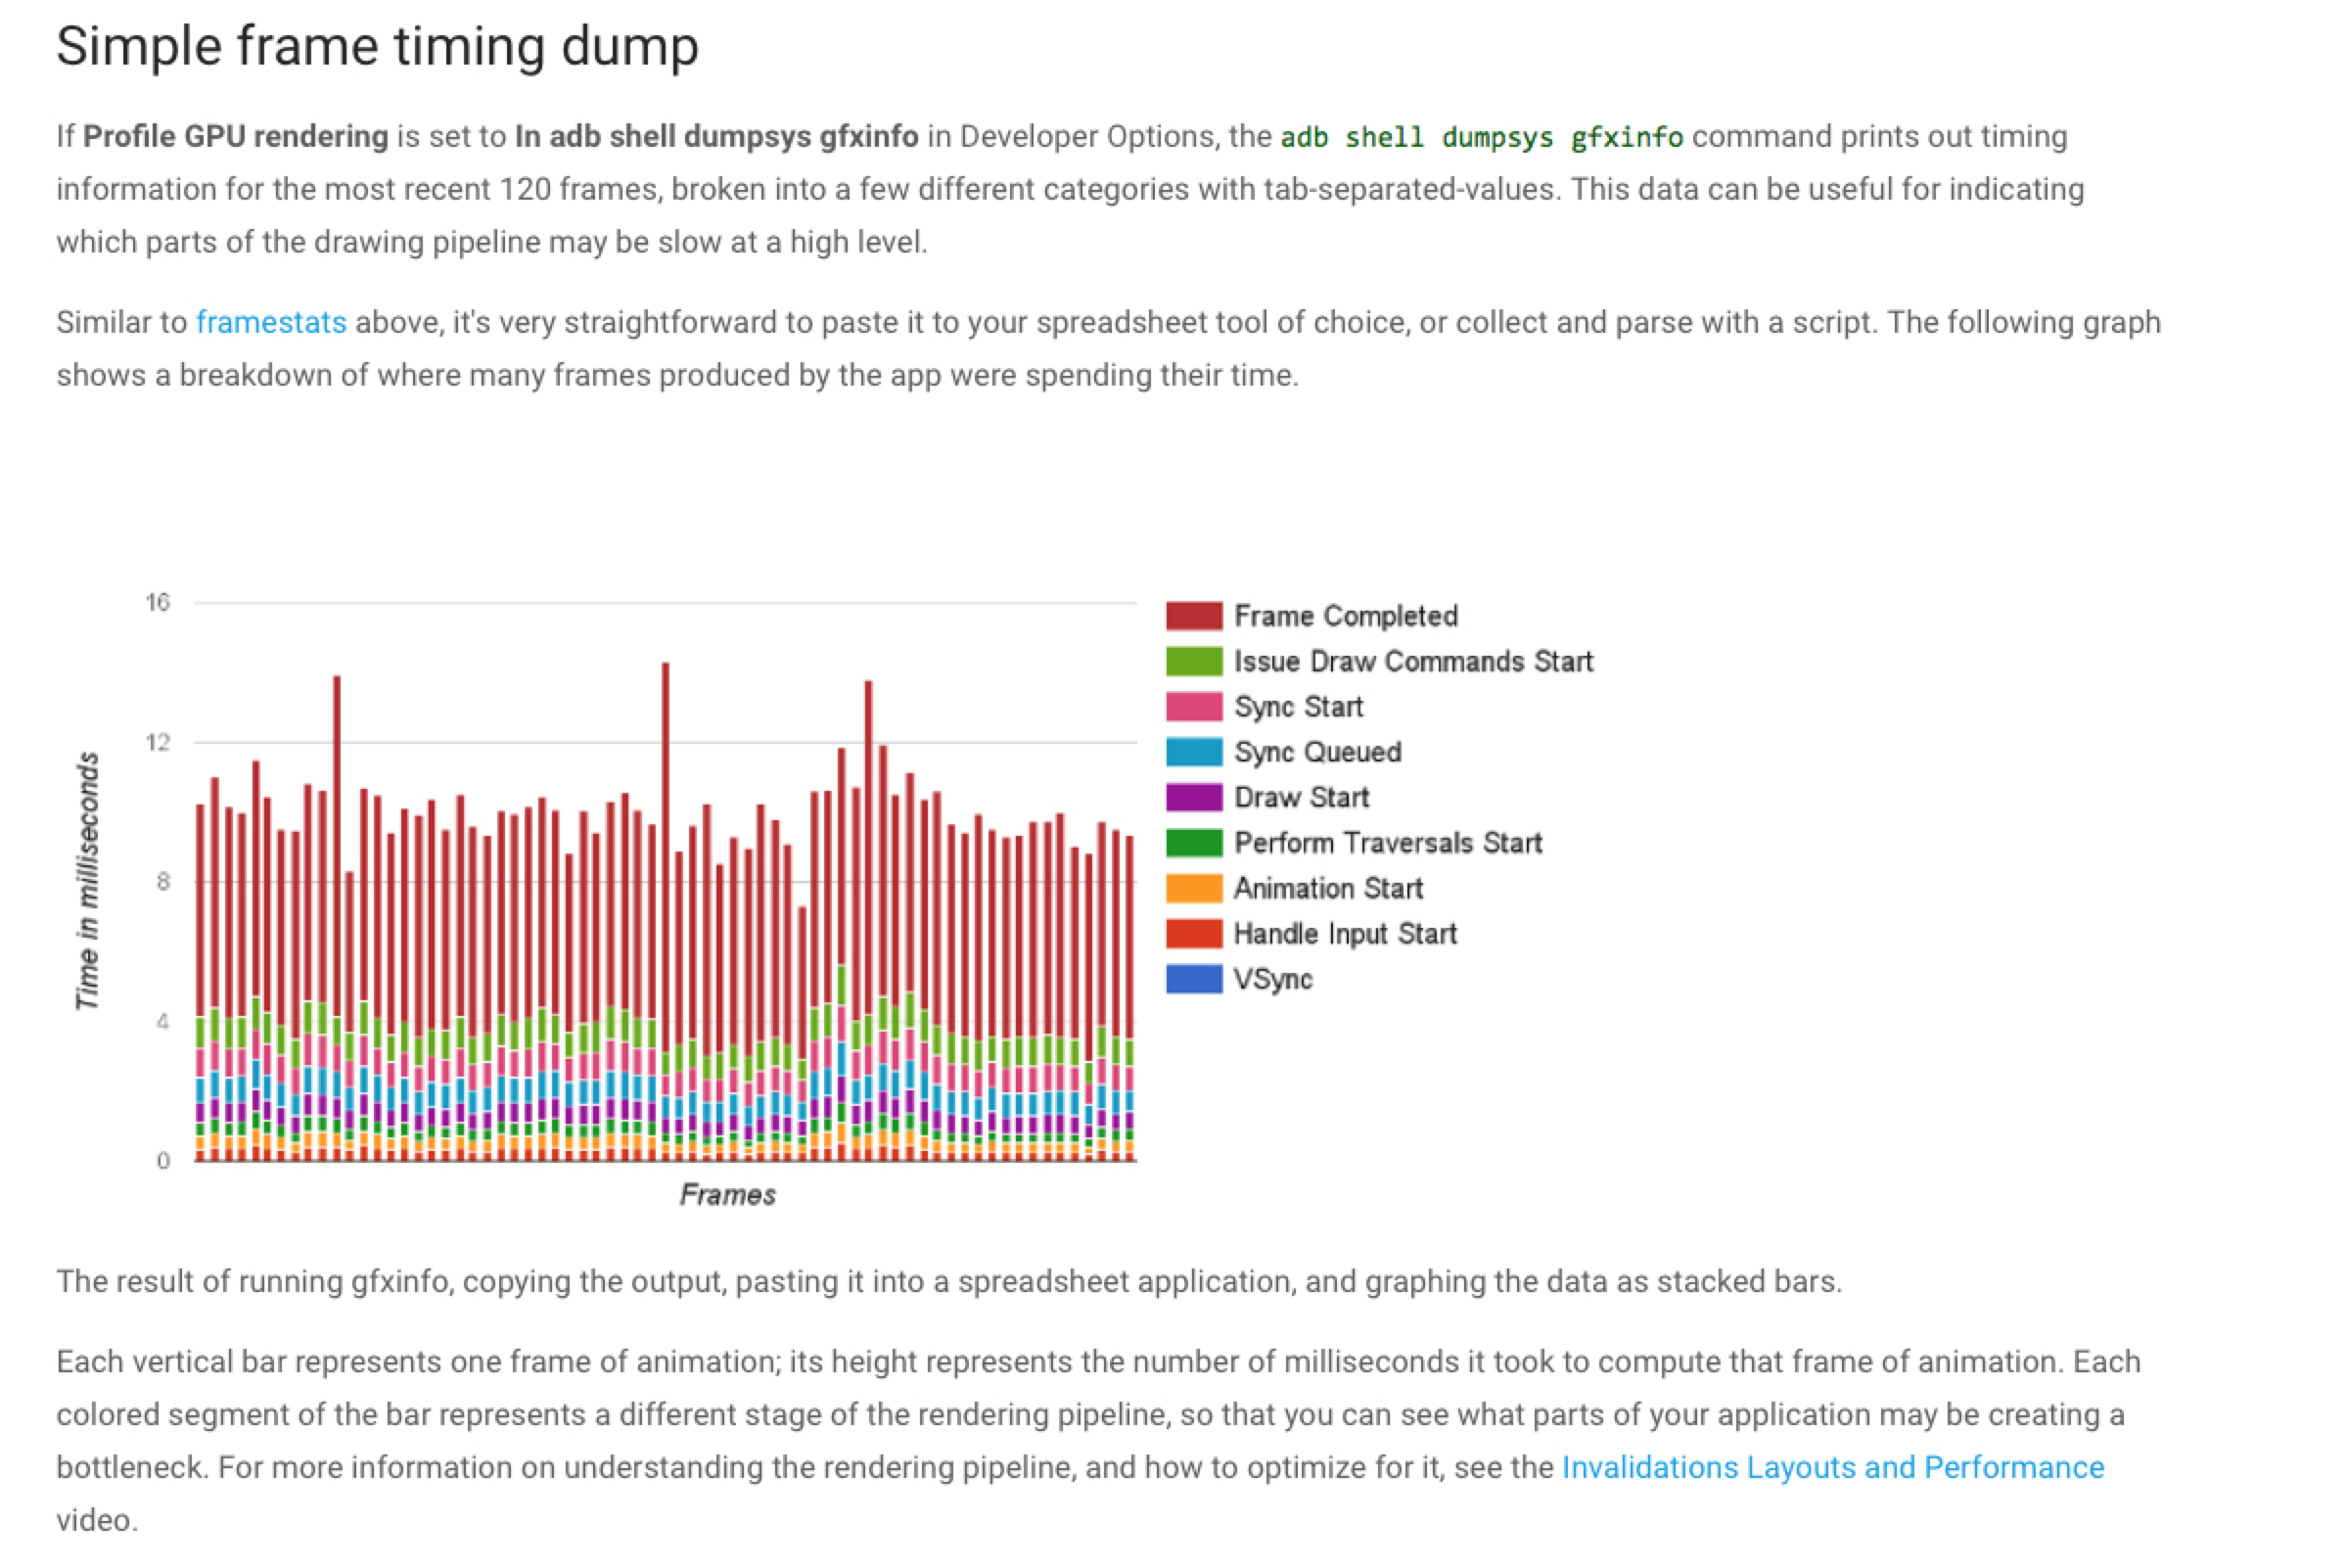
- testing UI performance
GPC FF告警解决办法
手动测试、自动测试、解决关键问题——后续输出指南/标准
- 手动测试重要场景,找到问题场景,解决痛点
- 自动化测试——搭建自动化测试、完善UI测试标准、足够好用的情况下考虑加入到后续新入UI的考量手段中
- 主动防御——对UI的实现标准化操作进行总结、输出至业务开发人员,提高UI质量
基本知识
认识冻结帧FrozenFrame(FF)
- 定义
- why 60 fps
- 16.67ms
Google Play Console(GPC)针对FF的各项指标含义
Data collection details
Google collects the render time of each frame rendered by your app when using the UI Toolkit framework, not when using OpenGL directly.
控制面板
- Impacted sessions——每日会话中,绘制时间>700ms的帧总数超过所有会话帧0.1%的用户占比
- Number of sessions——被记录的帧数量
- 90th/99th percentile(ms)——90%/99%的用户的所有帧绘制时间都低于这一值
图表指标(比率均是针对所有绘制超过16.67ms的帧)
- Missed Vsync——丢失系统Vsync信号的占比(理解VSYNC)
- High input latency——这些超过16.67ms的帧中输入法用时超过24ms的帧占比
- Slow UI thread——UI thread用时超过8ms
- Slow draw commands——给GPU发送绘制指令用时超过12ms
- Slow bitmap uploads——bitmap上传至GPU用时超过3.2ms
示例
ORG Google play console data
FF所属大类——SlowRendering
- identifying jank
- fixing jank
- 查看常规的反面示例
- 如何避免——耗时操作应在非UI线程完成
- UI复杂时
- Common sources of janks
- Scrollable lists
- RecycleView:notifyDataSetChanged
- RecycleView:Nested RecyclerViews
- RecyclerView: Too much inflation / Create taking too long
- RecyclerView: Bind taking too long
- RecyclerView or ListView: layout / draw taking too long
- ListView: Inflation
- Layout performance
- Layout performance: Cost
- Layout performance: Frequency
- Rendering performance
- Rendering performance: UI Thread
- If Record View#draw is taking a long time, it’s often the case that a bitmap is being painted on the UI thread. Painting to a bitmap uses CPU rendering, so should generally should be avoided. 使用Android CPU Profiler 确诊问题
- Rendering performance: RenderThread
- Canvas.saveLayer()
- Animating large Paths
- Canvas.clipPath
- Rendering performance: UI Thread
- Thread scheduling delays
- Object allocation and garbage collection
- Scrollable lists
testing UI performance
- measuring UI performance
- automating UI performance Tests
Why
可能诱因
How——定位问题
Visual inspection
- Run a ==release== (or at least non-debuggable) version of your app. The ART runtime disables several important optimizations in order to support debugging features, so make sure you’re looking at something similar to what a user will see.
- Enable Profile GPU Rendering. Profile GPU Rendering displays bars on the screen that give you a quick visual representation of how much time it takes to render the frames of a UI window relative to the 16-ms-per-frame benchmark. Each bar has colored components that map to a stage in the rendering pipeline, so you can see which portion is taking the longest. For example, if the frame spends a lot of time handling input, you should look at your app code that handles user input.
- There are certain components, such as
RecyclerView, that are a common source of jank. If your app uses those components, it’s a good idea to run through those parts of the app. - Sometimes, jank can be reproduced only when the app is launched from a cold start.
- Try running your app on a slower device to exacerbate the problem.
Systrace
- Systrace shows when each frame is drawn and color codes each frame to highlight slow render times. This helps you find individual janky frames more accurately than visual inspection. For more information, see Inspecting Frames.
- Systrace detects problems in your app and displays alerts both in individual frames and the alerts panel. Following directions in the alert is your best option.
- Parts of the Android framework and libraries, such as
RecyclerView, contain trace markers. So, the systrace timeline shows when those methods are executed on the UI thread and how long they take to execute.
If systrace doesn’t show you details about why UI thread work is taking for a long time, then you’ll need to use Android CPU Profiler to record either a sampled or instrumented method trace.
Custom performance monitoring
If you can’t reproduce jank on a local device, you can build custom performance monitoring into your app to help identify the source of jank on devices in the field.
To do this, collect frame render times from specific parts of your app with FrameMetricsAggregator and record and analyze the data using Firebase Performance Monitoring.
Solution
- To fix jank, inspect which frames aren’t completing in 16.7ms, and look for what is going wrong. Is Record View#draw taking abnormally long in some frames, or perhaps Layout? See the Common sources of jank below for these problems, and others.
- To avoid jank, long running tasks should be run asynchronously outside of the UI thread. Always be aware of what thread you’re code is running on and use caution when posting non-trivial tasks to the main thread.
- If you have a complex and important primary UI for your app (maybe the central scrolling list), consider writing instrumentation tests that can automatically detect slow render times and run the tests frequently to prevent regressions. For more information, see the Automated Performance Testing Codelab.
Automated Test codelab
Topic
- How to quickly navigate some Android Performance tools
- How the Espresso testing framework can be used to write unit and performance tests
- How to use MonkeyRunner and Gradle to automate the testing workflow
- How to review systrace output to understand your app’s performance issues
Tips
在traceView中,选中帧后,按M键,可高亮帧
1
2
3
4
5
// start tracing to "/sdcard/calc.trace"
Debug.startMethodTracing("calc");
// ...
// stop tracing
Debug.stopMethodTracing();frame dump